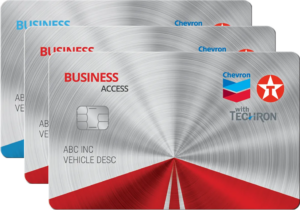
Fuel waste often goes unnoticed without data showing where inefficiencies occur. Businesses may suspect problems but lack specific information on root causes. Fleet fuel cards generate insights from transaction data, helping pinpoint where fuel is wasted and which operational changes may reduce consumption.
Data-driven waste reduction and fuel savings are a powerful combo. The two work together with the Chevron Texaco Business Card. Apply today and take advantage of detailed consumption analytics and reports to help identify waste and optimize fleet fuel usage.
Showing drivers their consumption versus colleagues often motivates improvement more effectively than abstract goals.
Fuel Economy Tracking by Vehicle
Declining fuel economy often signals developing problems. A vehicle requiring more frequent refueling may have mechanical issues, tire pressure problems, or aggressive driving affecting efficiency. Without tracking, these problems typically go unnoticed until major failures occur.
Fleet cards can monitor fuel economy through transaction data by capturing gallons purchased and odometer readings. Per-vehicle calculations reveal which units achieve strong efficiency and which consume excess fuel, requiring investigation.
Miles-Per-Gallon Calculations
Dividing miles driven by gallons consumed produces fuel economy metrics comparable across similar vehicles. Five identical delivery vans should produce similar MPG figures. Significant deviations suggest specific vehicle problems rather than design differences.
Tracking MPG trends over time helps identify declining efficiency, which can indicate mechanical issues. A vehicle averaging 15 MPG dropping to 12 MPG over several months warrants inspection before minor problems become expensive repairs.
Baseline Establishment and Deviation Monitoring
Establishing baseline efficiency expectations for each vehicle type helps identify meaningful deviations. New vehicle baselines set performance standards. Gradual declines from baselines can trigger maintenance investigations before fuel costs increase.
Seasonal adjustments account for weather-related changes in efficiency. Winter fuel economy typically runs 10–15% below summer performance. Adjusted baselines help distinguish normal variation from problems requiring attention.
Driver Behavior Analysis
Driver habits affect fuel consumption. Aggressive acceleration, excessive idling, and high-speed driving can reduce efficiency by 15–30% compared to moderate operation. Fleet card data can identify drivers exhibiting wasteful behaviors requiring coaching.
Comparing drivers operating similar vehicles on comparable routes isolates behavior as the efficiency variable. Strong performers set benchmarks, while others receive targeted training based on actual consumption data.
Driver-to-Driver Consumption Comparisons
Driver efficiency rankings reveal top and bottom performers. Drivers achieving 18 MPG in vehicles averaging 15 MPG demonstrate techniques worth sharing. Drivers at 12 MPG need coaching on ways to increase efficiency.
Peer comparisons make efficiency measurable. Showing drivers their consumption versus colleagues often motivates improvement more effectively than abstract goals.
Identifying High-Waste Drivers
Drivers consistently consuming 20–30% more fuel than peers on identical routes may exhibit aggressive driving, excessive idling, or other wasteful habits. Targeted coaching can improve efficiency without broad training programs.
Data-based discussions are more effective than general feedback. Presenting actual consumption figures and peer comparisons helps drivers understand their impact.
Vehicle-Specific Waste Identification
Individual vehicles consuming excess fuel despite proper operation may have mechanical problems. Underinflated tires, dirty air filters, or engine issues create waste. Fleet card data can help flag these vehicles for maintenance.
Comparing similar vehicles helps distinguish mechanical issues from driver-related ones. A vehicle consuming 20% more fuel, regardless of the driver, suggests mechanical problems. A vehicle performing inconsistently across drivers indicates behavior issues.
Per-Vehicle Efficiency Trends
Monitoring individual vehicle efficiency over time helps identify developing problems. Gradually declining MPG suggests mechanical degradation. Sudden drops indicate issues needing immediate diagnosis.
Maintenance correlation analysis examines whether efficiency problems follow missed service intervals. Vehicles overdue for tune-ups, filter changes, or tire rotations often show declining efficiency.
Mechanical Issue Indicators
Specific efficiency patterns suggest particular mechanical problems. Sudden 20% drops often indicate acute failures such as oxygen sensor issues. Gradual 5–10% declines over months suggest buildup issues such as clogged filters or worn spark plugs.
Diagnostic prioritization uses efficiency data to guide maintenance. Vehicles with the lowest efficiency receive immediate attention, while others follow standard schedules.
Underinflated tires, dirty air filters, or engine issues create waste. Fleet card data can help flag these vehicles for maintenance.
Excessive Idling Detection
Extended idling wastes fuel without contributing to operations. Vehicles idling during breaks or meals burn fuel without purpose. This often goes unnoticed without tracking.
Some fleet cards, like the Business Access Card from Chevron and Texaco, integrate with GPS or telematics data to identify excessive idle time. Fuel consumption without corresponding mileage suggests excessive idling, an issue requiring driver education or policy enforcement.
Idle Time Tracking Integration
Telematics systems record engine-on time versus driving time. Large gaps between total engine hours and driving hours indicate excessive idling. This data helps quantify waste.
Driver-specific idle patterns show who idles more than necessary, helping identify training opportunities.
Climate Control Idling Identification
Running heating or air conditioning while parked wastes fuel. Drivers may idle for comfort during breaks or waiting periods. Alternatives such as parking in the shade or using auxiliary power can reduce this waste.
Seasonal idle tracking shows whether waste increases in summer or winter, helping focus training.
Unauthorized Purchase Detection

Fuel cards may be used for unauthorized purchases, including personal vehicle fueling or non-fuel items. These expenses provide no business value. Transaction analysis can identify suspicious patterns.
Unusual activity, such as multiple transactions at one station, inconsistent refueling frequency, or purchases in unexpected locations, may indicate misuse.
Suspicious Transaction Patterns
Multiple purchases within short timeframes suggest card sharing or unauthorized use. Three transactions at one station within two hours typically indicate misuse.
Premium fuel purchases for vehicles designed for regular fuel, or diesel purchases on gasoline cards, indicate unauthorized use or potential fraud.
Location-Based Anomaly Detection
Purchases far outside operational areas suggest personal use. A fleet serving one city should not generate transactions far away without justification.
Weekend or after-hours purchases during non-operational periods may indicate unauthorized use.
Route Inefficiency Identification
Poor routing increases fuel use through unnecessary miles, congestion, and inefficient stop sequences. A delivery route with 15 stops may consume significantly more fuel if poorly sequenced. Transaction data combined with route information can reveal inefficiencies.
Comparing fuel consumption across similar routes helps identify routing problems rather than vehicle or driver issues.
Fuel Consumption by Route Analysis
Tracking fuel costs by route shows which territories consume excess fuel. Some areas are affected by unavoidable factors, such as hills or traffic, while others reflect planning inefficiencies.
Route optimization software combined with fuel data helps quantify improvement opportunities and potential savings.
Traffic and Congestion Impact
Routes through congested areas increase fuel consumption due to stop-and-go traffic. Comparing consumption across times of day helps quantify this effect.
Alternative routes bypass congestion and may use less fuel, even if they are longer.
Cost-Per-Mile Benchmarking
Fuel costs must be normalized by miles driven. Two vehicles may consume similar fuel but travel different distances. Cost-per-mile metrics standardize comparisons.
Industry benchmarks provide context for internal metrics and help evaluate performance.
Vehicle Class Comparisons
Cost-per-mile varies by vehicle type. Comparisons within the same class provide meaningful insights, while cross-class comparisons may be misleading.
Top-performing vehicles within each class set efficiency benchmarks. Lower-performing units warrant investigation.
Operational Cost Insights
Combining cost-per-mile with maintenance expenses shows total operating cost and supports vehicle lifecycle decisions.
Service territory analysis highlights which areas are more expensive to serve, informing pricing and expansion decisions.
Seasonal Waste Pattern Recognition
Fuel consumption varies seasonally due to weather, operations and driver behavior. Winter often increases consumption by 10–15% due to cold starts and heating use. Understanding these patterns helps distinguish normal variation from waste.
Year-over-year comparisons improve accuracy by accounting for seasonal factors.
Weather Impact Quantification
Extreme weather affects efficiency. Cold temperatures reduce fuel economy by prolonging warm-up times and increasing air density. Hot weather increases air conditioning load. Measuring these effects helps set realistic expectations.
Regional differences in efficiency often align with climate conditions.
Operational Pattern Changes
Seasonal business shifts affect fuel use. Delivery volumes may increase during holidays, while construction may slow in winter. These patterns help explain changes in consumption.
Peak periods may reduce efficiency due to tighter schedules and increased operational demands.
Fuel waste identification requires detailed data analysis to locate inefficiencies. Comparing Chevron and Texaco fleet card options helps businesses choose the right card for their needs.
To learn more about Chevron and Texaco fuel cards, visit chevrontexacobusinesscard.com.